
Opensource data tools to the rescue
Opensource data tools to the rescue
How I leveraged opensource tools and the community to analyze my local network

In this post, I’ll share the steps I used to figure out that a virtually unused Amazon Fire Tablet was consuming huge amounts of my network bandwidth. And I’ll also shout out to the folks in the community who provided invaluable help!
More network woes
Seriously, when I started writing about data, I thought I would be sharing about my experiences with building and maintaining an affordable data pipeline. I never imagined I’d be talking about my local network and ISP and the challenges in getting the data I need to figure out which people and devices on my network are putting me at risk of getting deprioritized by my ISP.
After my first post on this subject, My link to the stars just got bit clearer, I thought the problem was solved by creating a scheduled rule on my firewall limiting when my Xboxes could use the internet, and I could move on. But part of moving on was making it easy for my family to temporarily disable the firewall rule blocking the Xboxes so they could play. Who would have thought that would lead to another deep dive into local network usage analysis.
Reducing clutter
To give my family quick access to Home Assistant for disabling the Xbox firewall rule, I installed Home Assistant on an old, unused Amazon Fire Tablet and put it on the counter in the kitchen. I put the tablet right next to the screen that displays the data for our dumb (non-smart?) weather station and quickly realized that the clutter wasn’t going to meet the “Wife Acceptance Factor” - and I even thought it looked cluttered.
After a bit of exploring, I found a great service called Ambient Weather Network that I could embed within Home Assistant and go back to having just 1 screen on the counter. I just needed to configure the tablet to keep the screen on all the time so we could glance over and quickly check the temperature and weather forecast. Keeping the tablet from going to sleep probably ended up being a major factor in my new bandwidth woe.
Firewall calamity!
In order to gain better visibility into the traffic flowing through my network, I previously replaced my ancient physical router/firewall with OPNsense running in a virtual machine. This has been working quite well, but because I wanted the ability to figure out which devices on my network were consuming bandwidth, I had all of the logging turned up pretty high and was retaining the data for 30 days, oh, and I had the web proxy cache enabled and configured to use 30GB, which just so happened to be the same size as the root drive OPNsense created from the 40GB I allocated the VM. (Who knew OPNsense would allocate 8GB to virtual memory!) You can probably see where this was going…
heavy logging + minimal grooming + large cache = Disaster!
Well, my disk filled up and my fancy new firewall blocked all access to the internet. Diagnosing and fixing the issue took me a couple of hours and involved some very urgent education around finding large files/directories on Linux (skills I’m happy I now possess!).
OPNsense reporting was inadequate anyway
With the firewall operational again, I considered allocating more disk space, but the usability of the reports in OPNsense left a lot to be desired so rather than doubling down on an inadequate solution, I decided to find an alternative way to view the data. That’s when I found this:

That dashboard looks so awesome I jumped right in! It took several hours across a couple of days and only when I was done, I realized that it didn’t show the per-host usage data that I needed. But I don’t have any regrets because it is useful, and inspirational!
I spent a while exploring the data and realized that the host-level data I needed wasn’t even being captured so I did some more thorough searching on the internet to find what I really needed.
Just Right!
I came across another post and there was another tantalizing picture, but this time I did more due diligence.

The author of this post, Jahnin Rajamoni, explained that he was in a situation similar to my own with limited bandwidth and a need to understand which devices were using it. And it looked like it was going to be super easy because it used Grafana and InfluxDB, which I had already set up for the previous dashboard!
A dashboard of my own
As with most things, it took considerably longer than anticipated. While it uses some of the same tools, the ntopng tool that plugs into my OPNsense firewall only works with an older version of InfluxDB, so I leveraged the docker-compose.yaml file from Brendan’s solution above and added a container for InfluxDB 1.8. Once I was done, I was able to create this masterpiece 😉:
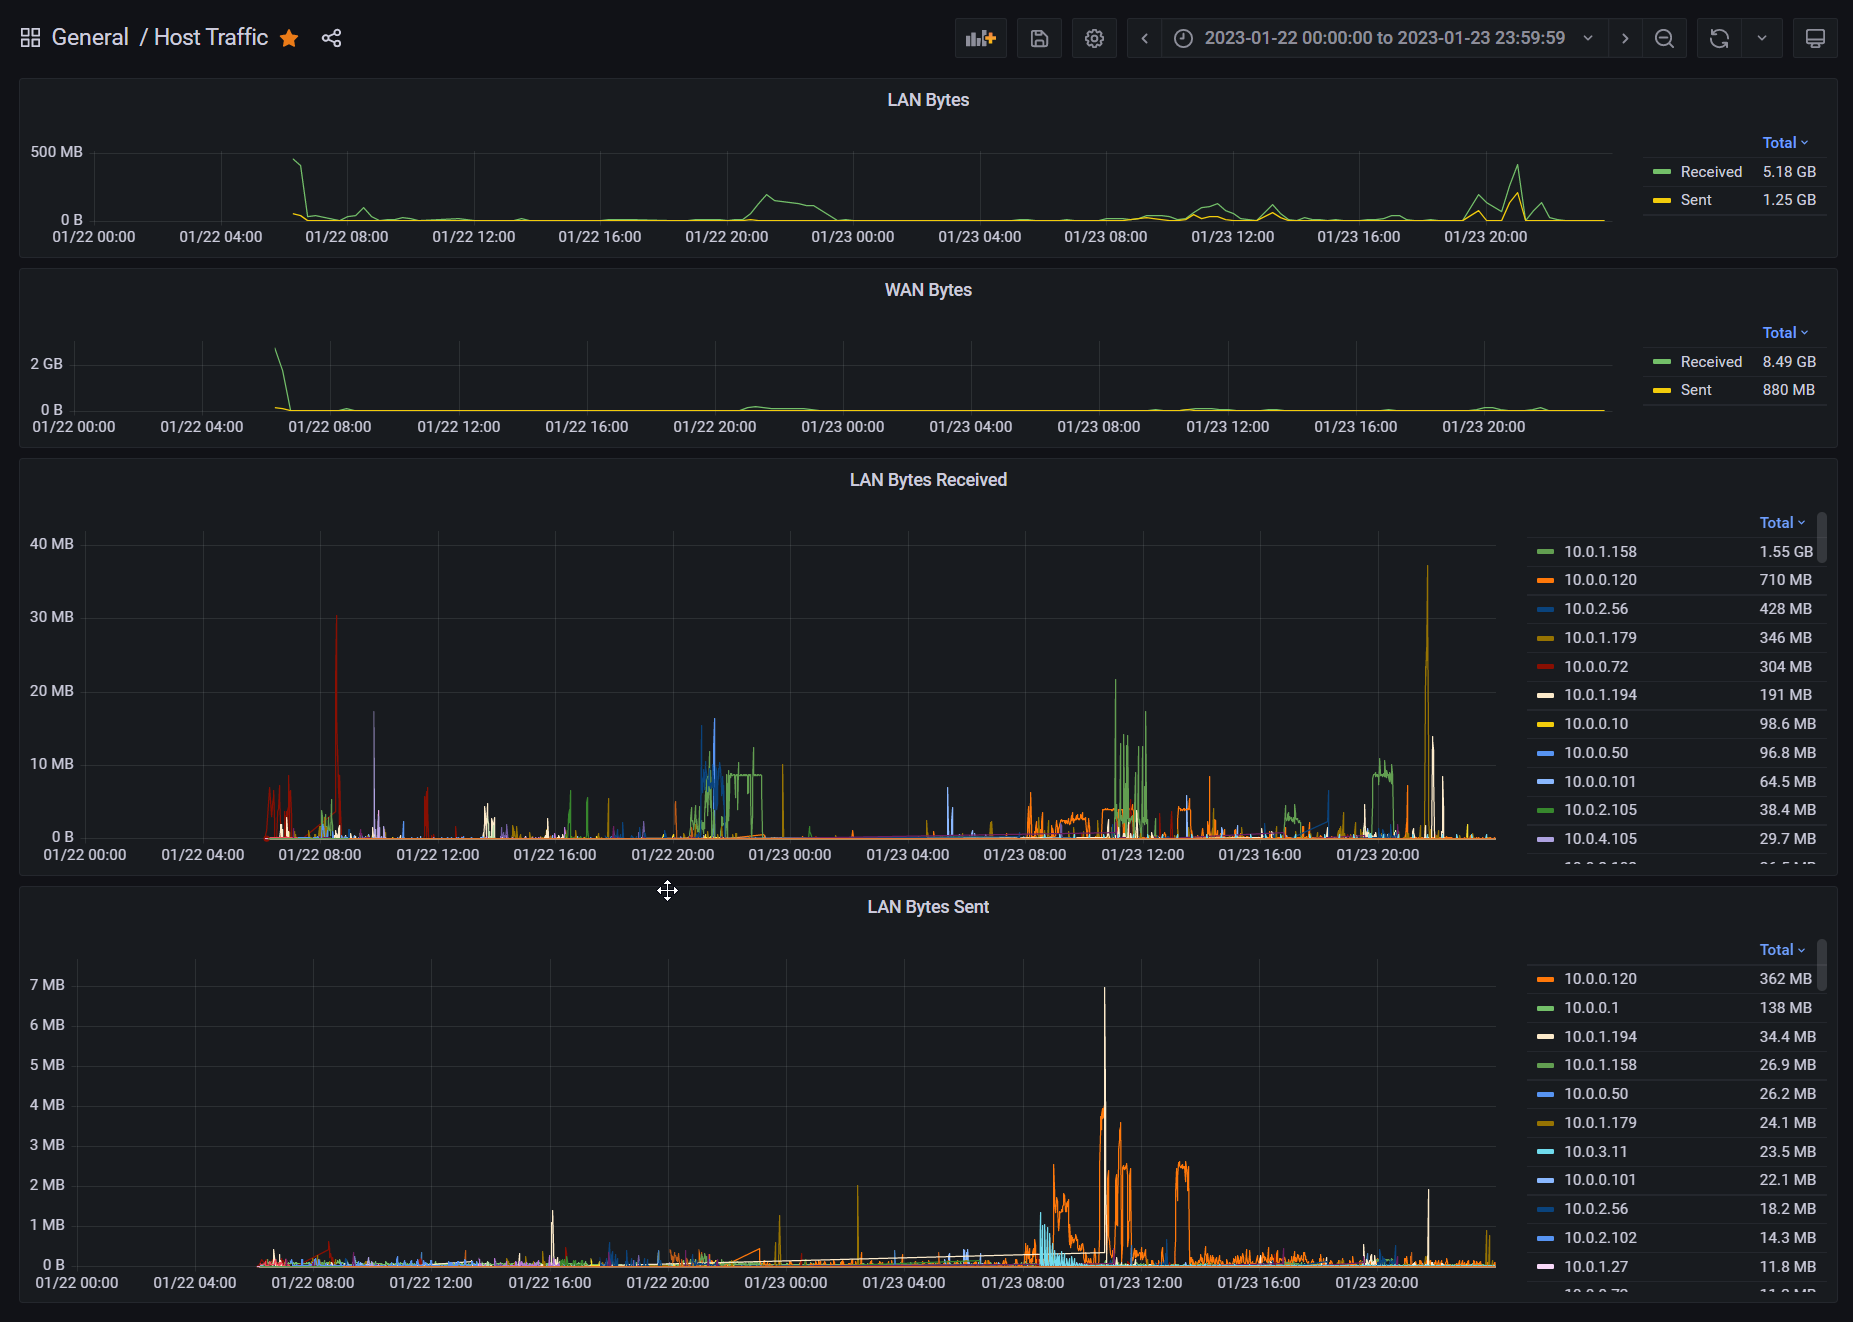
Gotcha!
It’s not as fancy as the others (yet), but it gave me just what I needed! See that red squiggly line in the LAN Bytes Received chart?
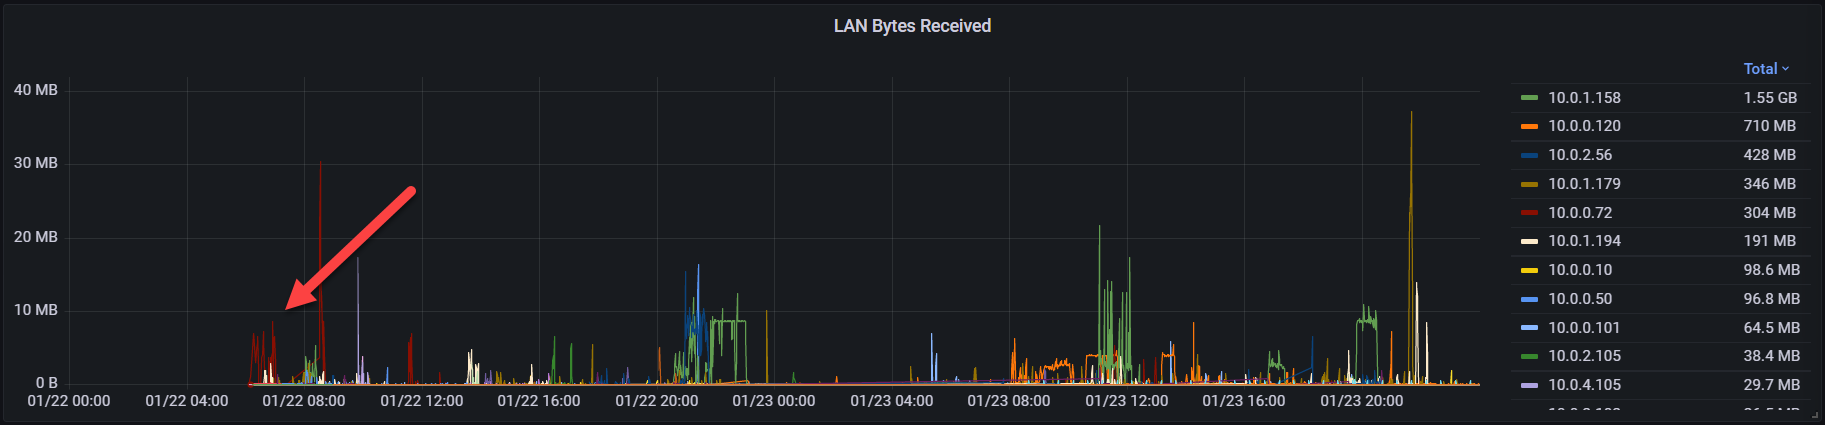
Surprisingly, that was my Amazon Fire Tablet that I thought was doing nothing besides periodically refreshing a weather web page.
After noticing the problem in Grafana, which had little historical data at this point, I did some more exploration in the ntopng dashboard and was surprised to find that the tablet had been consuming multiple gigs of data every day for a couple of weeks.
Fixed it!
As much as I would like to know what on earth the tablet was doing with all that data, part of me was afraid to ask and the other part was ready to move on. So, I did a factory refresh on the tablet, reinstalled just the Home Assistant app and now the tablet is causing no trouble. The big red spike on the chart is me reimaging the tablet and downloading updates, etc.
Time to get some other work done before the next critter pops its head up in this frustrating game of whack-a-mole!